

Summary
The Summary page is the operational overview for a jail. It combines lifecycle controls, current resource usage, historical telemetry, editable identity information, logs, migration, and deletion in one place.
Read the current state
Section titled “Read the current state”The first card identifies the jail and reports its latest state:
| Item | Meaning |
|---|---|
| Name | The current display name. When available, the text beside it shows how long ago the jail started or stopped. |
| Status | Running for an active jail, Stopped for an inactive jail, or the backend state when it cannot be classified normally. |
| CPU Usage | Current CPU use as a percentage, followed by the configured CPU-core limit. If resource limits are disabled, the host’s logical-core count is shown instead. |
| Memory Usage | Current memory use as a percentage of the jail’s configured memory limit. If resource limits are disabled, total host memory is used as the reference. |
Stopped jails report zero current CPU and memory usage. Values refresh while the page is visible.
Jail overview and telemetry
Section titled “Jail overview and telemetry”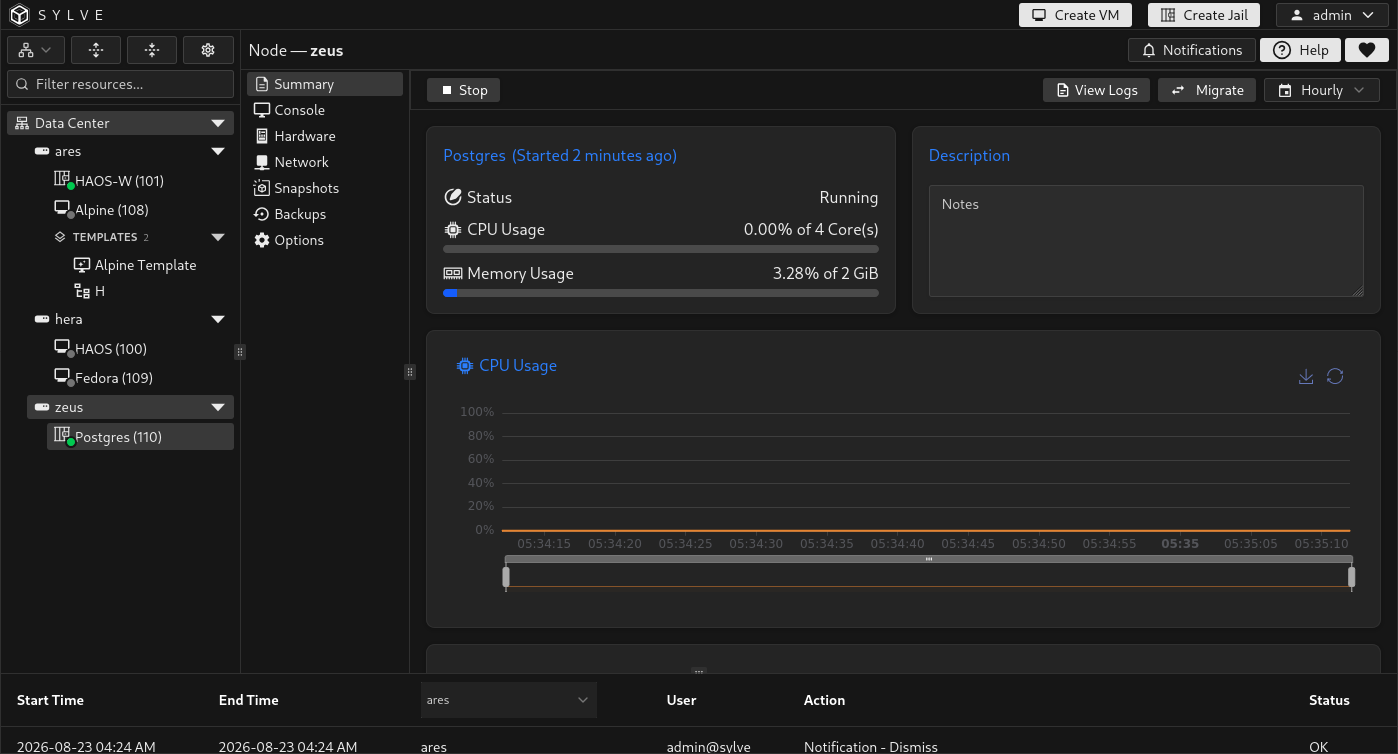
Rename the jail
Section titled “Rename the jail”Hover over the jail name and select the pencil action to edit it. Press Enter or select the checkmark to save, or press Escape to cancel.
The new name must use the normal Sylve guest-name format and must not already belong to another jail. Renaming changes the managed display identity but does not change the Jail ID, ZFS dataset path, hostname, or network configuration.
In a clustered or replicated environment, the node must own the jail’s replication lease before it can rename the guest.
Update the description
Section titled “Update the description”Edit the Description field directly. Changes are saved automatically after a short pause in typing, so there is no separate save button. Descriptions may be empty and are limited to 1024 characters.
Use the description for concise operational context such as the workload, owner, maintenance notes, or service role. A failed update produces a notification and does not silently replace the stored value.
Use lifecycle controls
Section titled “Use lifecycle controls”The top toolbar exposes the action appropriate for the current state:
- Start appears when the jail is stopped.
- Stop appears when the jail is running.
- Delete appears when the jail is stopped.
Start and stop are queued lifecycle tasks. After a request is accepted, the ordinary action buttons are hidden and a spinner badge identifies the pending action. Wait for that action to finish before requesting another lifecycle change.
The state refreshes automatically, but a successful queue response only means that the task was accepted. Confirm the final jail state before depending on the workload.
To move the workload to another cluster node, follow the dedicated Jail Migration guide.
Review historical usage
Section titled “Review historical usage”The CPU and memory charts display recorded jail telemetry. Use the calendar selector in the toolbar to choose:
- Hourly
- Daily
- Weekly
- Monthly
- Yearly
The page automatically chooses an initial resolution and continues refreshing recent telemetry while the jail is active. Selecting a range requests the matching stored series.
The charts distinguish between several empty states:
- No samples have ever been recorded for the jail.
- No samples exist in the selected range.
- The last sample is outside the supported graph history.
- Telemetry could not be loaded and is being retried.
Graph history is available for up to 70 days. The Yearly view therefore summarizes the supported retained history rather than guaranteeing a complete year of raw samples.
View jail logs
Section titled “View jail logs”The View Logs action appears when the jail log contains data. Select it to open the log viewer.
While the dialog is open, the page checks for new content every few seconds. It follows the newest output automatically while the scroll position remains near the bottom. Scroll upward to inspect older entries without being pulled back down; return to the bottom to resume following.
The log is the managed jail lifecycle log. For application-specific logs, use the Jail Console and inspect the appropriate files or service output inside the jail.
Follow lifecycle output
Section titled “Follow lifecycle output”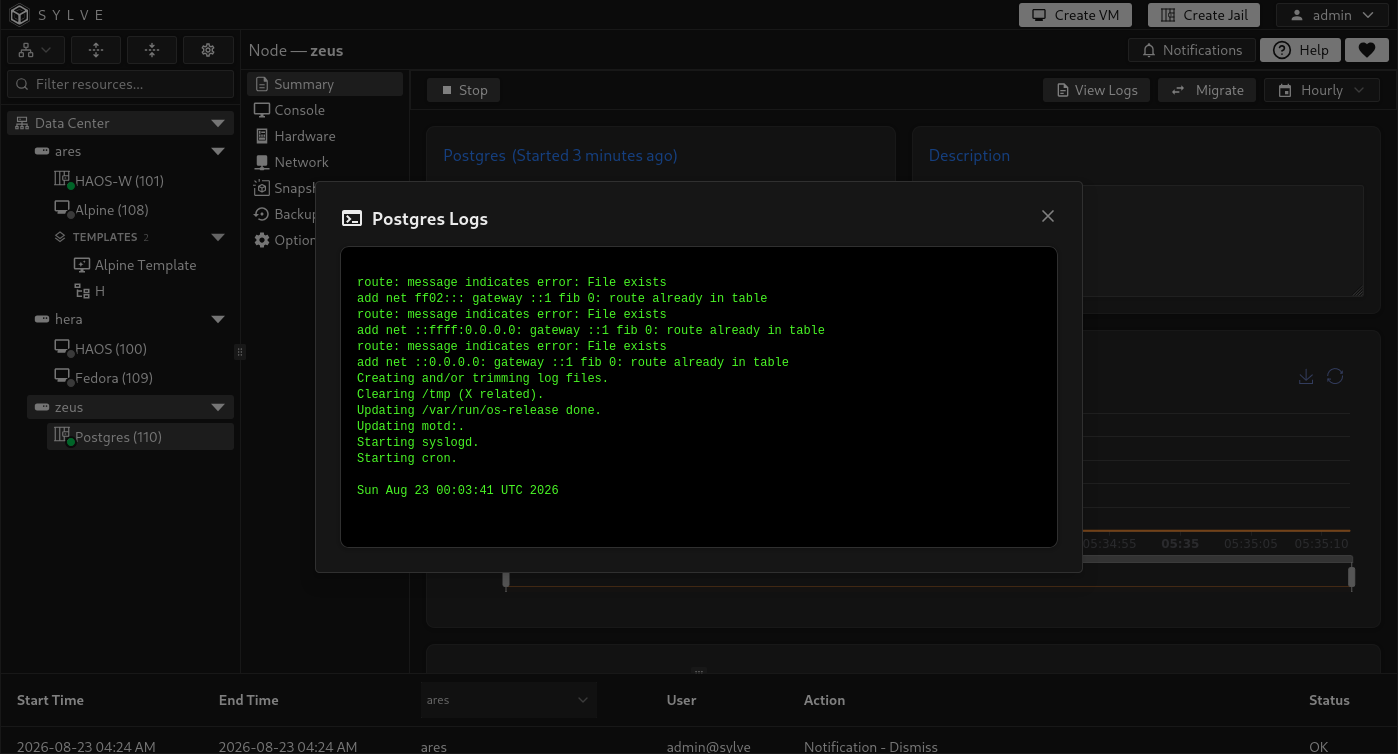
Delete the jail
Section titled “Delete the jail”Stop the jail, then select Delete to open the confirmation dialog. Deletion removes the jail registration and managed runtime configuration. Storage and MAC cleanup are separate choices so that potentially useful resources are not destroyed accidentally.
| Option | When disabled | When enabled |
|---|---|---|
| Delete MAC Object(s) | Managed MAC objects associated with the jail are retained. | Sylve removes associated MAC objects when they are no longer in use. |
| Delete Root Filesystem | The jail’s ZFS root is retained as unmanaged data. | Sylve destroys the managed jail root dataset. |
Review deletion choices
Section titled “Review deletion choices”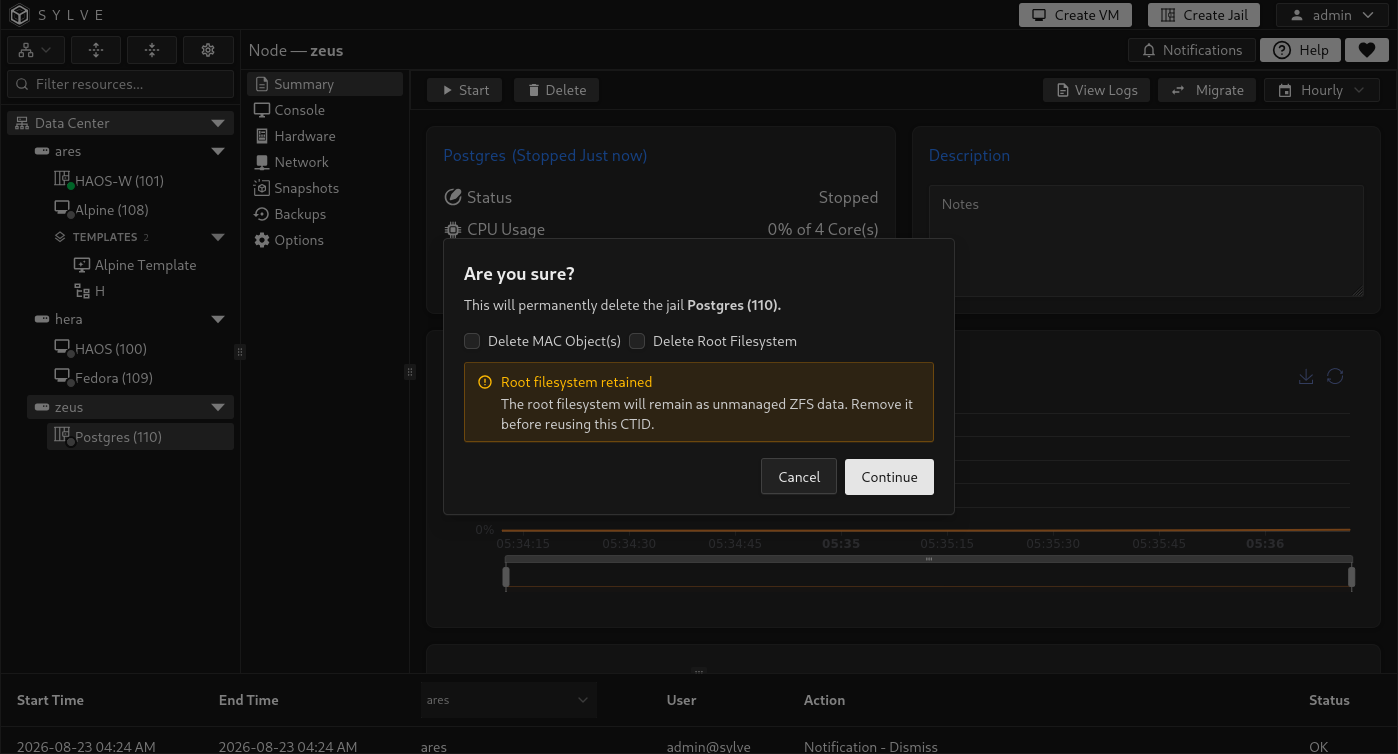
Deletion is rejected while any backup job or replication policy still references the jail, including disabled jobs or policies. Delete those jobs and remove the replication policy before deleting the guest so a future workload cannot inherit its backup or replication identity.
After registration removal, storage or MAC cleanup can still encounter an error. Sylve reports incomplete cleanup and retained datasets in a notification so they can be handled manually rather than presenting partial cleanup as complete success.
Suggested operational workflow
Section titled “Suggested operational workflow”- Confirm the jail name, ID, state, and recent resource use.
- Review historical CPU and memory patterns before changing limits.
- Check lifecycle logs when a start or stop task behaves unexpectedly.
- Stop the jail before maintenance that changes storage, network, or low-level options.
- Delete backup jobs and remove the replication policy before deletion.
- Decide explicitly whether the root dataset and MAC objects should be retained.